Other Software, Projects and Prototypes
Overview
Following are examples of NHDS's other products and prototypes. They are mostly in the healthcare sector, but the list also includes customers in other industries.
From 2012-2018, NHDS's participated in 5 Federal workgroup projects which where tasked with defining certain health information technology standards. During that time, we built several prototypes presented below.
Our prototypes demonstrate some of the capabilities of the company's software development framework. These tools use inexpensive and highly functional Microsoft 365 (formally Office) tools, along with HIPAA compliant web-based tools for data input and browser presentation on all devices.
Healthcare Products and Prototypes
The following describes some of the products and prototypes we've developed.
Clinical Pathways tool
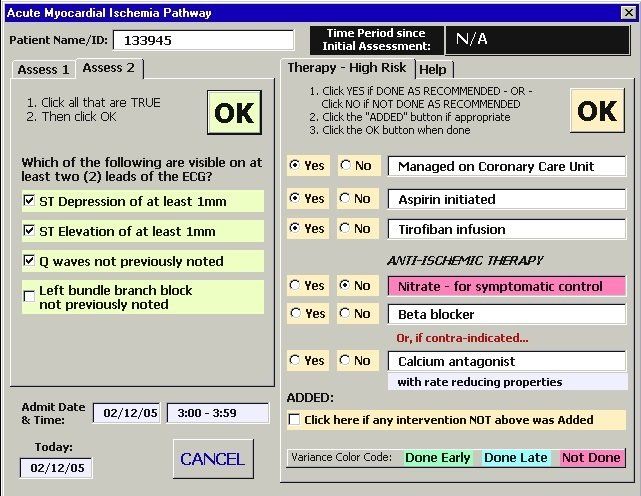
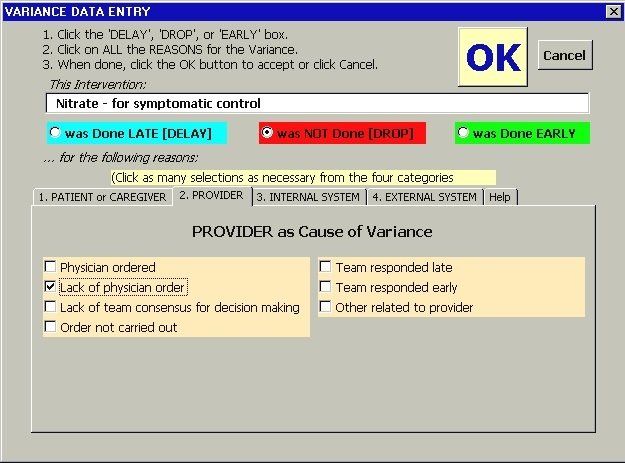
A clinical pathway (care pathway, integrated care pathway, critical pathway, or care map) is a tool used to manage healthcare quality through standardization and tracking of care processes. The first image shows part of the initial assessments that helps determine the severity of the patient’s condition and then presents the series of recommended, time-dependent interventions of which one was not completed are recommended (i.e., it was "at variance"). The second image is the form used to collect details about interventions at variance. And the third is one of the aggregate outcome reports.
The information captured and analyzed help answer questions such as:
- Which high-cost interventions and technologies justify their cost?
- Which clinicians, diagnostic techniques, and procedures produce good results consistently enough to warrant teaching them broadly?
- How should pathways be modified to bring about the best outcomes for each patient type?
- Why do personnel depart from cost-effective pathways?
Referral Manager and Messaging system
With just a few mouse clicks, a primary care physician (PCP) sends referral forms—tailored to each patient’s condition—to selected specialists and receives their replies via automated, HIPAA compliant, encrypted e-mail attachments. The PCP then sends clinical information containing detailed patient data and receives specialist’s feedback in the same manner. Everything sent and received are tracked and easily retrievable.
Mental Health Life Chart tool
This tool depicts a person’s mental health status, treatments, and significant life events over time in a format that is easy to use and understand. The example below covers seven years of a patient with bipolar disorder that shows which combination of medications and therapy had the best result in controlling the patient's mood, as well as events associated with mood instability. Note that similar charts can be constructed for many other disorders.
Medication Management tool
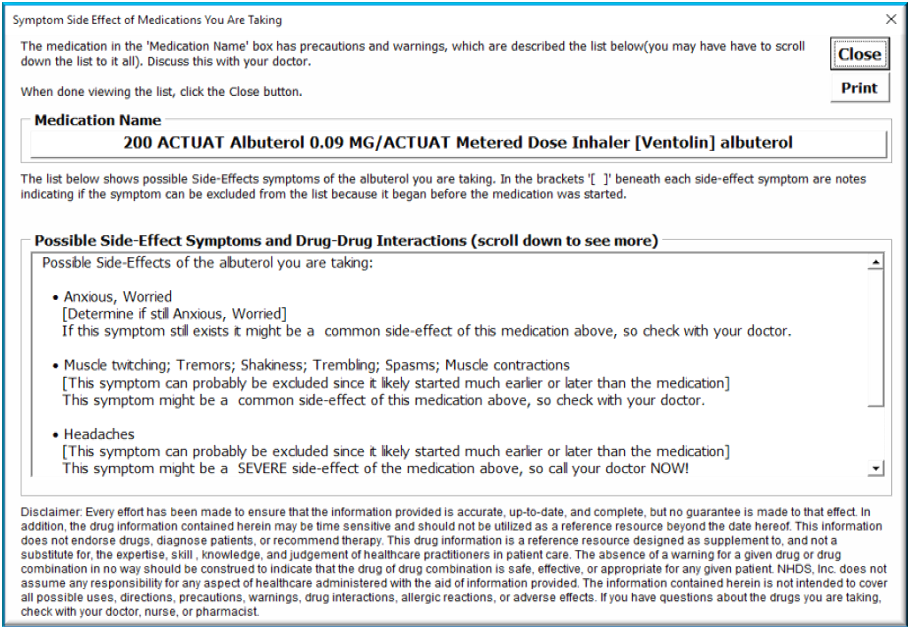
The upper first image below show a prototype tool that presents changes in a person's medications in a simple and clear view whenever a new list of medications is integrated into an existing (original) list. The bottom two images show how the tool collects data about a person's symptoms (lower bottom image) and associates them with possible side-effects of medications the person is taking. Both prototypes use common medication standard clinical drug vocabulary.
Pain Management tool
The pain management tool was deployed in a nursing home and is designed to collect all data elements based based on government regulations.
Sample Non-healthcare systems
In addition to healthcare tools, NHDS has demonstrated the capabilities of its underlying software development technology in other industries. Following are a sampling of screenshots showing its inputs and outputs.
Enterprise Market Opportunity Calculator (EMOC™)
The EMOC prototype is designed to support enterprise project management and sales.
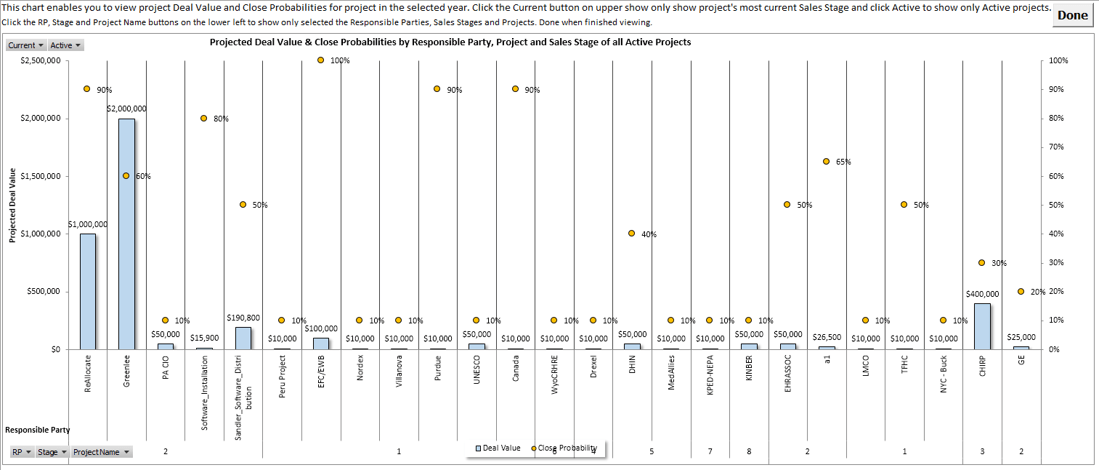
EMOC presents a “birds-eye view” of work activities associated with the pursuit of revenue (including marketing, sales and delivery workflows). Its interactive dashboard, tables and charts enable management, sales, delivery and administrative personnel to monitor their pipeline.
The system incorporates workflow-driven business intelligence analytics that identify the value of an opportunity and its risks at each of eight sales stages (from lead generation to delivery of products and services to the customer).
Knowledge Management System: Environmental Resources Exploration
In the early 2000s we built a customized (one-off) knowledge management system for a major oil & gas company that used it on their deep-water oil exploration rigs around the world. It collects and disseminates lessons learned, best practices, health & safety alerts, documents, and drilling data to engineers on the rigs, which supported front-line decisions. Its daily drilling reports enabling rigs to view their own drilling progress in terms of depth and cost, compare it to projected costs, and to compare any rigs with any others.
The information it supplies provided an efficient way to improve cost estimations and offer immediate remedies for drilling problems as they occur, even on deep water rigs with low bandwidth communications.
The images below display fictitious data. The top group shows a few charts in the drilling data report for each rig that obtains data from centralized databases. The bottom group shows a portion of the form focused on obtaining and displaying knowledgebase reports related to lessons learned, best practices, and health & safety alerts.


